Every platform, tool and report is telling you a different story about your marketing. Here's how to figure out which numbers to trust, which to ignore, and how to make decisions anyway.
Quick answer: You'll never get one perfect number, so stop looking for it. Decide what "working" means for your business (qualified leads, pipeline, closed revenue), then use each source for the job it's good at. Click-based attribution shows which campaigns bring in qualified leads that turn into clients. Marketing mix modeling shows what each channel adds overall, including the stuff clicks can't see. Incrementality tests prove what your marketing actually caused. Your bank account tells you whether the whole thing adds up.
In this guide
- Why does every marketing number tell a different story?
- What does "working" actually mean for your marketing?
- Why do Meta, Google, GA4 and your CRM all disagree?
- How do you trace an ad click all the way to a new client?
- What can multi-touch attribution tell you, and what can't it?
- What is marketing mix modeling, and do you need it?
- How do you prove your marketing caused the results?
- Why is attribution about to get harder?
- Which number should you use for which decision?
- How do you hold your agency and your team accountable?
- Where should you start this week?

Why does every marketing number tell a different story?
Here's what most marketing leaders are dealing with right now.
Meta says your campaigns are crushing it. Google says it's actually Google doing the work. Your agency's monthly report says everything is up and to the right. Your attribution tool says something else again. Your CRM has its own opinion about where your leads came from, and your sales team says half of them are junk. And your bank account? Your bank account says growth is flat.
That's five or six sources of truth, and none of them agree. So what the hell do you look at?
A few weeks ago I sat down with the marketing lead at a charity. Her agency sends her a report every month, full of reach, clicks, cost per click and conversions. She told me she knows the numbers are convoluted. She just can't prove it, and she can't tell which of them connect to actual donations.
A few days later I heard the same story from a national financial brand running dozens of campaigns across several product lines. Their agency reports account openings, and the total looks great. But it's added up across business lines, so nobody can tell which product actually grew or which campaigns did the work.
Neither of these is a story about a bad agency. They're stories about numbers that are technically correct and still lead to the wrong decision.
I've spent the last few years building measurement software, and I see this in almost every account we connect. Smart people, real budgets, and a nagging feeling that they can't prove what's working. You're not alone in that. In a 2025 TransUnion and EMARKETER survey of 196 US marketers, 60% said people inside their own company question their marketing metrics at least sometimes. Nearly 29% said up to 20% of their budget had been moved or put at risk because of those doubts.
Here's my position, and it's the thread through this whole article: you don't need one perfect number. You need to know what each number is actually measuring, what it's good for, and which decision it should drive. Once you know that, the noise turns into something you can use.
Let's start with the question most teams skip.
What does "working" actually mean for your marketing?
You can't tell if marketing is working until everyone agrees what it's supposed to do.
This sounds silly. Of course you know what marketing is for. But ask five people in your company what marketing's job is and you'll get six answers. The marketer says leads. The sales team says deals. The CFO says revenue. The agency says whatever the contract says, which is usually leads, or clicks, or ROAS.
For a lead-gen business, "a result" can mean any of these:
- Leads: someone filled in a form.
- Marketing-qualified leads (MQLs): a lead that fits who you sell to.
- Sales-qualified leads (SQLs): a lead sales agrees is worth a conversation.
- Opportunities and pipeline: a real deal, with a dollar value attached.
- Closed-won revenue: money in the bank.
For ecommerce, the ladder is shorter but has the same trap: a first order, a second order, a customer who keeps coming back, a certain order size.
Each step down is worth more and is harder to see. Ad platforms are great at the top of that list. They mostly can't see the bottom, because it happens later, in a CRM, on a sales call, or in a bank's back office.
Why this causes fights between marketing, sales and agencies
Here's where it gets messy. Marketing gets paid for leads. Sales gets paid for revenue. So marketing pushes volume, sales complains the leads are garbage, and both are right by their own scoreboard.
The same thing happens between agencies and clients. The agency hits its lead target and calls the month a win. The client looks at revenue and wonders what they're paying for. Nobody lied. They just never agreed on what marketing's job was.
Here's how that plays out in real numbers. Two campaigns each bring in 200 leads at $50 a lead. On a standard report they're identical: same volume, same cost per lead, same green arrow.
Follow those leads for 60 days. Campaign A turns 30 of them into paying clients. Campaign B turns 5. Campaign A cost about $333 per client. Campaign B cost $2,000. Same report, six times the difference in what you actually paid for growth.
If you measure form fills, your marketing gets very good at producing form fills. That isn't the same as getting better at winning clients.
So before you look at a single dashboard, write down one sentence: "Marketing's job is to produce more ___ at a cost below ___." Get marketing, sales and your agency to sign off on it. Every number in the rest of this article gets judged against that sentence.
Why do Meta, Google, GA4 and your CRM all disagree?
They disagree because each one is counting something different. None of them is lying. Each one only sees its own slice of the journey, and each one reports on itself.
Here's the map I wish someone had handed me years ago.
| Source | What it actually counts | Why it runs high or low | Use it for |
|---|---|---|---|
| Ad platforms (Meta, Google, LinkedIn) | Conversions after a click on, or a view of, their own ads, plus conversions they estimate | Every platform claims any lead or sale it touched, so their totals overlap. Views count even when nobody clicked | Comparing ads and audiences inside that platform |
| Your agency's report | Usually the platform numbers, rolled up | Inherits the overlap, and someone chose which numbers to show | Seeing what your agency did, and why |
| GA4 | Website visits, labelled by channel from tracking tags and referrers | Loses the source of many visits to Direct or Unassigned. Can't see what happens after the website | Traffic trends and on-site behavior |
| A click-based attribution tool | Clicks linked to real leads or sales, across every channel, each sale counted once | Can't see ads people only viewed, or offline influence. Can't prove cause | Which campaigns bring in qualified leads and new clients |
| Your CRM | Leads, deals and revenue, with a "source" field | The source is often a guess: first visits get lost, so deals show up as Direct or Organic | What became pipeline and revenue |
| Your bank account | Money in, money out | Can't tell you which channel did the work | Whether the whole thing adds up |
Read that last row twice. Your bank account is the only number in the building nobody can inflate. If every platform says it's winning and revenue is flat, believe the bank account.
Why platform numbers add up to more than 100%
By default, Meta counts a conversion if it happens within 7 days of someone clicking an ad, or within 1 day of someone simply seeing one. Google, LinkedIn and TikTok have their own windows and rules. They also estimate conversions they can't directly observe.
So picture one prospect who sees your Meta ad, later clicks your Google ad, opens your newsletter and fills in your contact form. Meta counts the lead. Google counts the lead. Your email tool counts it too. One lead, three claims. Add up the platforms and you'll have more leads than your CRM does.
What we found when we checked platform claims against real sales
We ran this comparison on ecommerce brands we work with first, for one reason: every sale is recorded, so there's a clean answer to check the platforms against. That makes ecommerce the best place to see how big these gaps really are. The mechanisms behind them (overlapping claims, view-through credit, lost sources) work exactly the same way for leads. Treat these as real examples, not industry benchmarks. Our numbers count only sales we can link to a specific ad click, so they don't include view-through credit.
| What we compared | Platform said | Linked to real sales |
|---|---|---|
| Paid social return on ad spend, apparel brand, one week in May 2026 | 5.4x | 1.2x |
| Paid search return on ad spend, same brand and week | 6.1x | 8.83x |
| Meta return on ad spend, July to October 2026 | 18.96x | 2.92x |
| Revenue Google and Meta claimed, as a share of one brand's total revenue | 120% | About 52% traced to paid clicks |
A few more things from the same audits:
- In one week, the two platforms were off by a combined $60,027. Paid social overstated its revenue by $31,987 and paid search understated its own by $28,040, so the dashboards pushed budget toward the weaker channel.
- Paid social looked like it cost $96 per customer. For genuinely new customers it was $223. 58.4% of orders came from people who had already bought before.
- Shopify labelled 874 orders "Direct" in that one week, worth $174K. We could trace them to a real source.
- Across both brands in the fall audit, 56% to 60% of sales labelled "Direct" had a traceable source, and 22% to 31% were actually paid ads.
Here's the part that surprised me most. In May, paid search was under-reporting itself. By the fall, Google was over-claiming by about 1.8x at both brands. The error doesn't even point in a consistent direction. You can't fix platform numbers by knocking a fixed percentage off. You have to check them against real outcomes, every time: qualified leads and closed deals in your CRM, not platform conversions.
If you run lead gen, this matters even more. A sale is easy to check. A lead isn't. It shows up as a form fill, becomes qualified (or doesn't) days later, and turns into a client weeks after that, usually somewhere no ad platform can see. Every gap above has more room to hide in that journey. That's why the rest of this article is about following leads all the way to new clients.
GA4 and your CRM have their own blind spots
GA4 labels a visit by looking at the tracking tags on the link and the site the visitor came from. When those are missing, the visit becomes "Direct" or "Unassigned." That happens a lot: tags get left off, browsers and ad blockers strip information, and links opened inside apps or private messages often arrive with no source at all. One industry analysis estimates about 30% of GA4's Direct traffic actually came from another channel. On the brands we checked, at least 1 in 5 visits landed in a different channel than GA4 put them, even after we merged Google's own sub-channels.
Your CRM inherits the same problem, then adds its own. HubSpot or Salesforce usually learns about a person when they fill in a form. Any visits before that, on a different device or after cookies were cleared, are often lost. So a deal that started with a LinkedIn ad six weeks earlier shows up as "Organic" or "Direct." The campaign that started it gets zero credit, looks weak on the next report, and is often the first thing cut.
How do you trace an ad click all the way to a new client?
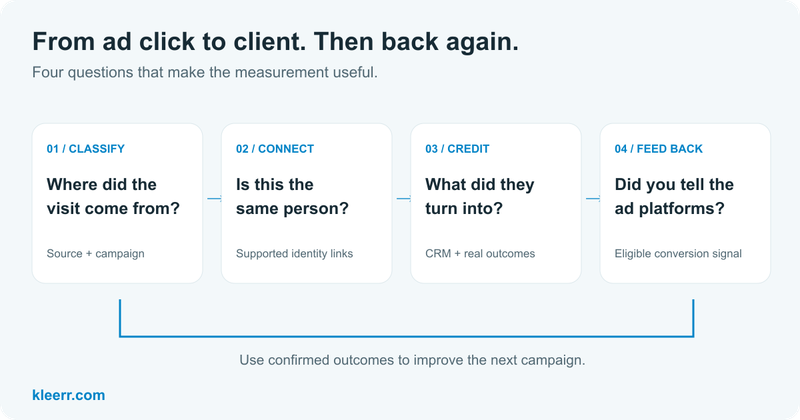
Every number you can trust has to answer four plain questions. Miss one, and every report built on top of it is shaky.
- Where did this visit come from?
- Is this the same person as before?
- What did they turn into?
- Did you tell the ad platforms?
1. Where did this visit come from?
We covered why GA4 and your CRM lose sources. The fix is to read more than tracking tags and referrers. At Kleerr we also use other information that comes with a visit, including other data in the link, cookies, and the visitor's earlier history with your site, to work out where each visit really came from. I won't publish our rules, but on the brands we checked, 28% of visits got their label from signals GA4 can't read at all, mostly a visitor's earlier history.
A different label doesn't automatically mean a better one, so we only change a label when there's a specific signal behind it.
2. Is this the same person as before?
Picture a typical B2B lead. A finance director sees your LinkedIn ad on her phone during her commute and taps through. A week later she searches your name on her work laptop and reads two pages. Three days after that she clicks a retargeting ad and fills in your contact form.
To most tools, that's three different strangers. The form gets credited to the retargeting ad, and the LinkedIn campaign that started it all looks like it did nothing.
This isn't rare. At the brands in our fall audit, about half of first-time buyers visited at least twice before they bought, and that's for a single purchase. Choosing a firm to hire or a bank to open an account with is a much bigger decision. People rarely make it in one visit.
Connecting those visits is hard, and it's easy to cheat. Here's the rule we hold ourselves to: an unknown is better than a confident wrong answer. A cookie shows the same browser, not the same person. Something the person gives you, like the email on a form, is much stronger evidence. Once that email shows up, we can link it to earlier visits on that browser and to other devices where the same email appears. If we're not sure two visits belong to the same person, they stay separate. That costs a little coverage, and it's why the numbers hold up when someone checks.
3. What did they turn into?
This is where most reporting stops short. A form fill is where things start getting interesting, not where they end.
For lead gen, the trail works like this: connect the form submission to the visits that came before it, then follow that person through the stages in your CRM (HubSpot or Salesforce, for example): lead, qualified, opportunity, closed deal. Now every campaign can be judged against whichever outcome you wrote down in that one sentence from earlier: a qualified lead, a booked meeting, a trial start, an opened account, a closed deal.
This is also where lead quality finally becomes visible. For each campaign, look at what share of its leads become qualified, and what share of those become clients. The campaign with the cheapest leads is rarely the one with the cheapest clients. Ecommerce has its own version of this trap: remember the $96 versus $223 gap between all customers and genuinely new ones.
4. Did you tell the ad platforms?
Ad platforms learn from the conversions you send them. If all you send is "someone filled in a form," they get very good at finding people who fill in forms, including people who'll never become clients.
Meta, Google and LinkedIn all accept later outcomes, like a qualified lead or a signed client, through conversion APIs or offline conversion uploads. Sending the event isn't enough on its own, though. Bidding only changes when the campaign is set to optimize for that event, and each platform has its own setup rules and volume needs. A qualified lead you can send every day often works better than a closed deal you get three of a month. We go deep on choosing and testing that signal in What Should You Optimize Your Ads For?
You can only tell a platform "this click became a client" if the first three questions have solid answers. That's why they come first.
What can multi-touch attribution tell you, and what can't it?
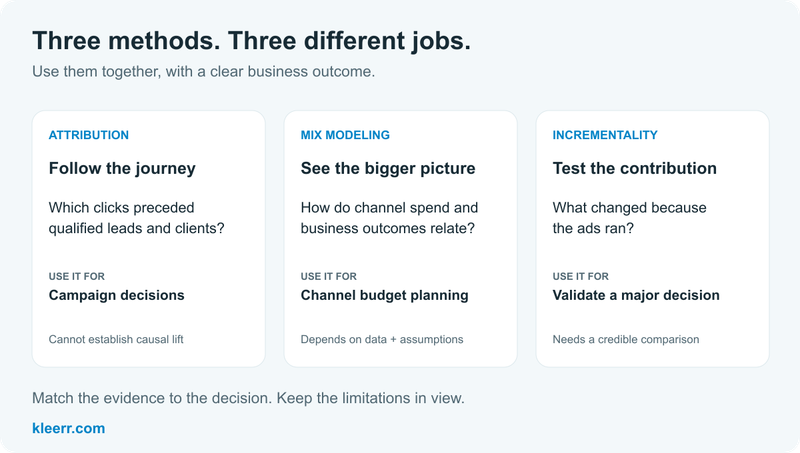
Multi-touch attribution shows you which clicks led to a qualified lead or a new client. It can't see ads people only looked at, and it can't tell you whether they would have bought anyway.
I'm a big believer in multi-touch attribution. It's most of what we built Kleerr on. But I've also watched a lot of marketers expect it to do things it can't, so let's be clear about both sides.
How it's different from what the platforms report
The three numbers people mix up most are platform-reported conversions, view-through conversions and multi-touch attribution. They're measuring different things.
| Platform reporting | View-through | Multi-touch attribution | |
|---|---|---|---|
| What counts | Clicks and views of that platform's own ads | Someone saw an ad, didn't click, and bought later | Clicks across every channel, linked to the real lead or sale |
| Who gets credit | That platform, every time it touched the sale | The ad that was seen | Shared across the clicks in the journey, each sale counted once |
| Strength | Great for comparing ads inside one platform | Hints at influence clicks can't show | Shows real paths to real customers, and you can check every one |
| Weakness | Overlaps with every other platform | Can't tell a persuaded buyer from someone who'd have bought anyway | Blind to views, offline influence and cause |
That's why Meta's number and your attribution tool's number will never match. When we showed Meta reporting 18.96x and our click-linked number at 2.92x, the gap between them is what Meta is claiming for views, for conversions it estimates, and for sales other channels also touched. Some of that gap is real influence. Some of it would have happened anyway. Attribution alone can't tell you which. We wrote more about this in our guide to view-through attribution.
What multi-touch attribution is great at
- Showing real journeys. Which ad started it, what they read, what brought them back, what finally got the form filled.
- Judging campaigns on real outcomes. Which campaigns, audiences and ads bring in qualified leads and customers, not just clicks.
- Bottom-of-funnel and lead-gen work. Search, retargeting and lead campaigns leave a trail of clicks, so this is where it shines.
- Fixing waste fast. Spotting spend that reaches people who are already clients, or campaigns whose leads never close.
- Feeding the platforms better data. The same linked outcomes are what you send back to the ads.
What it can't do
- See ads people only viewed. Video, display and a lot of social influence never produce a click.
- See influence that happens off-screen. A podcast mention, a billboard, a colleague's recommendation, a share in a group chat.
- Tell you the "true" credit. Every way of splitting credit (first click, last click, evenly, or by a model) is a choice. None of them is the objectively correct answer.
- Prove cause. This is the big one.
Here's a common example. You spend $20,000 on retargeting ads shown to people who already visited your site, and the platform reports 200 leads at $100 each. Looks great. But these people already knew who you were. How many would have come back and filled in your form anyway? If most of them would have, your real cost per new lead is far higher than $100, and no amount of click tracking will tell you that.
That's not a reason to stop using attribution. It's a reason to pair it with two other tools. The first is the one most teams are missing.
What is marketing mix modeling, and do you need it?
Marketing mix modeling (MMM) looks at how your spend in each channel and your results moved together over time, and estimates how much each channel actually added, including everything a click trail can't see. If you spend real money across several channels, you probably need it. And you'll need it more every year.
If I could get every marketing leader to add one thing to their measurement this year, it would be this. Here's my blunt take: if you spend meaningfully across several channels and you don't have a mix model, you're making your biggest budget decisions with the least evidence.
How marketing mix modeling works, in plain English
Picture a spreadsheet with one row for every week of the last year or two.
- Some columns are your spend in each channel: Meta, Google, LinkedIn, a podcast sponsorship, maybe TV or radio.
- One column is the result you care about: qualified leads, pipeline created, or revenue.
- The rest are things that also move results and aren't ads: seasons, holidays, promotions, price changes, the size of your sales team, even the economy.
The model looks at all those ups and downs. Weeks when LinkedIn spend jumped and Google stayed flat. Weeks when you paused Meta. The spring promotion. From all of it, it estimates how much of your results each channel was responsible for.
Three things make it different from attribution:
- No tracking of individual people. No cookies, no clicks, no identity matching. That makes it immune to ad blockers and privacy changes by design.
- It accounts for delay. Ads keep working for days or weeks after they run. A good model builds that in. In B2B, where a deal can close months after the first ad, this matters a lot.
- It accounts for diminishing returns. Doubling spend in a channel almost never doubles results. The model estimates where each channel starts to flatten out.
What it tells you that attribution can't
- What each channel adds in total, whether people clicked or not.
- The halo effect. How your video and social ads drive people who later search your brand name, which attribution credits to search.
- How much of a platform's view-through claim is real. This is how you settle the 18.96x versus 2.92x question with evidence instead of opinion.
- Where the next dollar stops working. The point where another $1,000 in a channel buys much less than the last $1,000.
- What-if budgets. What likely happens to pipeline if you move 20% of your search budget to LinkedIn.
- Channels with no clicks at all. Podcasts, TV, radio, billboards, sponsorships, events.
- Your baseline. How much business you'd get with no paid marketing at all, from brand, referrals and repeat customers. Most teams have never seen this number, and it changes how they think about everything above it.
Who it's for, and who isn't ready yet
| Probably a good fit | Probably not ready yet |
|---|---|
| Spending meaningfully across two or more channels, enough that a 10% shift is real money | Running almost everything through one channel |
| At least a year of weekly data, ideally two | A new business, or tracking that changed recently |
| Spend that has gone up and down over time, or a willingness to vary it on purpose | Spend that's flat every single week, which gives the model nothing to learn from |
| One clear outcome tracked the same way the whole time | An outcome definition that changes every quarter |
| A real budget question you need answered | Wanting another dashboard |
If you're not ready yet, that's fine. Start with clean click-based attribution and a few simple tests, and start keeping weekly spend and outcome data now. In a year you'll have what a model needs.
What makes a mix model good, and what makes it useless
A good one:
- Is built on spend that has actually varied, so it can tell channels apart.
- Uses an outcome you trust, like qualified pipeline or closed revenue, not platform-reported conversions.
- Includes the things that aren't ads: promotions, pricing, seasons, sales capacity.
- Is checked against real experiments, and adjusted when it disagrees with them.
- Gets refreshed regularly, usually every quarter.
- Shows ranges, not single numbers. "LinkedIn returns $3 to $5 per dollar" is honest. "LinkedIn returns $4.17" is false confidence.
A useless one:
- Is built when every channel rose and fell together, like everything going up in Q4. It can't separate them, so it guesses.
- Leaves out a big promotion, and then credits the ads for the sales the promotion drove.
- Comes from a vendor who won't show you the assumptions.
- Never gets tested against reality.
Build it, borrow it, or have it done for you
You have three options. Google and Meta both publish free, open-source mix modeling tools (Meridian and Robyn). They're good, but they assume someone on your team can prepare the data, run the models and interpret them. Specialist consultants and vendors will build one for you. Or a measurement partner can build it on top of the data they already connect for you. That last option is what we do at Kleerr, and I'll come back to it at the end.
How mix modeling and attribution work together
They're not rivals. They answer different questions at different speeds.
- Mix modeling is for the big decisions, usually quarterly: how much goes to each channel, and how much in total.
- Attribution is for the day-to-day, weekly or daily: which campaign, which audience, which ad inside a channel.
- Incrementality tests settle arguments when the two disagree, and keep the model honest.
Think of it like this: the mix model is the map of the country, attribution is turn-by-turn directions, and a test is pulling over to check the road actually goes where the map says.
How do you prove your marketing caused the results?
You run a test. Hold some people or places back from your ads, keep running everywhere else, and compare. The difference between the two groups is what your marketing actually caused.
This is called incrementality testing, and it's the only way to see cause directly. Without it, you can't tell the people your marketing persuaded from the people who would have bought anyway. In an attribution report, they look exactly the same.
Go back to that $20,000 retargeting campaign reporting 200 leads. Say you hold back 10% of the audience for four weeks, so they never see the ads. If the held-back group fills in your form almost as often as everyone else, the ads weren't doing much. You just found money you can move somewhere it'll actually bring in new clients.
Three common kinds of test
| Test | How it works | Good for | Watch out for |
|---|---|---|---|
| Platform lift test | Meta or Google randomly holds a group of people back from your ads and compares them with people who saw them | The real effect of one platform or campaign | The platform runs it, and it needs enough volume |
| Geographic test | Turn spend off, or up, in some regions and keep it steady in similar regions | Any channel, including ones with no built-in test | You need regions that behave alike, enough volume, and a few weeks |
| On/off or budget step | Pause or raise a channel for a set period and compare against what you expected | Quick, rough reads when nothing else is possible | Noisy. Seasons and promotions can fool you |
What a good test needs
- One clear question. "Does LinkedIn retargeting add qualified leads we wouldn't otherwise get?" Not "does marketing work?"
- An outcome you trust. Qualified leads or pipeline from your CRM, not platform-reported conversions.
- Enough volume. If you get ten leads a month, a two-week test won't tell you anything.
- Enough time for the delay. In B2B, you may need to measure pipeline weeks after the test ends.
- A decision made in advance. Write down what result would make you cut, keep or scale before you see the numbers. Otherwise everyone reads the result the way they already wanted to.
Reading the results honestly
Results come as ranges, not single numbers. "No clear lift" doesn't always mean zero effect; sometimes the test was too small to see it. Big decisions deserve a repeat test. And every result should flow back into your mix model, so the model's estimates line up with what you've actually proven.
My rule of thumb: before you scale a channel by a big amount, test it. Before you cut one that attribution says is weak but your gut says is working, test that too.
Why is attribution about to get harder?
Because more of the buying journey is happening where clicks can't follow it, and soon AI agents will be filling in forms and buying things on people's behalf.
Click tracking has been losing ground for years. Ad blockers strip tracking tags off links. Safari limits how long many tracking cookies last, often to just seven days. Links opened inside apps, shared in private messages or clicked from AI answers often arrive with no source at all. Every one of those chips away at the click trail attribution depends on.
Here's my bet on what comes next, and I think it's the bigger shift.
People are starting to hand whole tasks to AI assistants. "Find me three accounting firms that work with nonprofits and book intro calls." "Get me quotes from three commercial cleaning companies." The assistant does the research, compares options, fills in the form or checks out. Your website sees a form fill or an order that came from nowhere. The LinkedIn ad the person saw last week, the podcast they heard, the review they read: none of it shows up. There's no click trail, because the person never clicked anything.
Multi-touch attribution can't follow a journey that never happened in a browser the person was using. So:
- Mix modeling and incrementality testing become the backbone. Neither one depends on tracking individual people, so neither one breaks when the clicks disappear.
- Attribution doesn't go away. Wherever there's still a click trail, like search, retargeting and lead forms, it's still the fastest feedback you'll get.
- Your own data gets more valuable. The email on the form, the stages in your CRM and the revenue in your books are the outcomes every model and every ad platform will need from you.
The teams that start building these habits now (weekly spend and outcome data, one agreed outcome, a regular testing rhythm) will have a year of clean history when everyone else is starting from zero.
Which number should you use for which decision?
Use the cheapest, fastest number that's good enough for the decision in front of you, and check the big decisions with stronger evidence.
This is the answer to "what the hell do I look at?" You don't pick one source of truth. You match the source to the decision.
| The decision | Use this | Check it with |
|---|---|---|
| Swap a creative, pause an ad, try a new audience | Platform reporting | The trend over a few weeks |
| Move budget between campaigns inside one channel | Click-based attribution to qualified leads or customers | Outcomes in your CRM |
| Find waste: ads reaching existing customers, leads that never close | Click-based attribution joined to your CRM | A sample of real records |
| Split next quarter's budget across channels | Marketing mix model | A test on the biggest move |
| Scale a channel by a lot | An incrementality test | Your mix model |
| Decide whether marketing is working at all | Your bank account: total revenue against total marketing spend, over time | Your mix model's baseline |
| Judge your agency or your team | The outcome you all agreed on, from your CRM | The five questions below |
Where should your next $10,000 go?
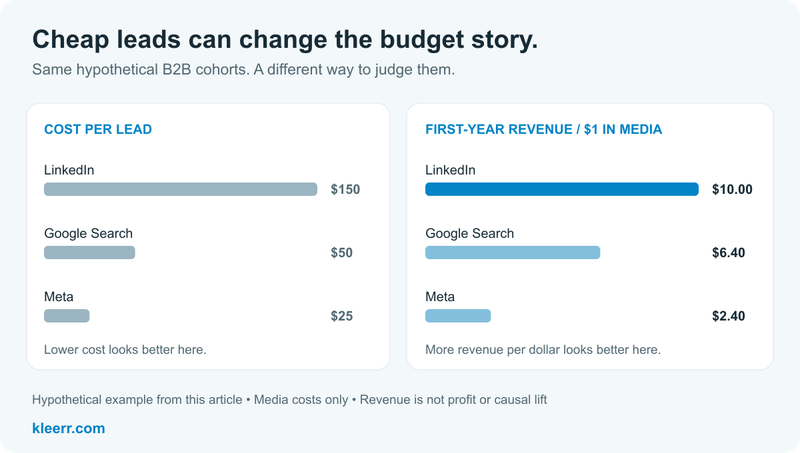
Here's how that plays out. A simplified example with made-up numbers for a B2B services firm. Every campaign's leads come from the same quarter and are measured 90 days later, so each has had the same time to turn into clients. Costs are media spend only.
| Campaign | Spend | Leads | Cost per lead | New clients | Media cost per client | First-year revenue | Revenue per $1 spent |
|---|---|---|---|---|---|---|---|
| $15,000 | 100 | $150 | 10 | $1,500 | $150,000 | $10.00 | |
| Google Search | $15,000 | 300 | $50 | 12 | $1,250 | $96,000 | $6.40 |
| Meta | $10,000 | 400 | $25 | 4 | $2,500 | $24,000 | $2.40 |
On a cost-per-lead report, Meta is the star and LinkedIn looks expensive. Followed through to revenue, the ranking flips.
But "move it all to LinkedIn" isn't automatically right either. A good decision also asks:
- How solid is the evidence? Ten clients is a small number. One big deal could be doing a lot of the work.
- Will the next dollar work like the last one? Google Search may already be reaching most of the people searching for you. More budget there might buy far less. That's a mix-model question.
- Is some of LinkedIn's success really its halo? If LinkedIn ads drive people who later search your name, cutting LinkedIn could quietly hurt Google too.
- Can the weak channel be fixed? Meta might improve a lot if it's told to find qualified leads instead of form fills.
- Is it worth a test? If the money is meaningful, split it and measure.
A reasonable call: put most of the $10,000 into LinkedIn, switch Meta's goal from form fills to qualified leads before deciding its future, and check how much room is left on Google. Then look again in 60 days.
That's what accountable marketing looks like. Not a perfect number. A decision you can explain, based on evidence you can check.
How do you hold your agency and your team accountable?
Agree on the outcome, own your data, and ask questions that can only be answered with real evidence.
Agency reporting has a trust problem, and it's not just my opinion. In a UK survey of 100 marketing managers by ASK BOSCO and OnePoll, 95% said their agencies highlighted positive metrics while downplaying negative ones, and 77% said they'd found inaccuracies in their reports. Small sample, but it matches what I hear in almost every conversation.
You don't need to become an analyst to fix this. Here are the five questions I'd start with.
- What share of our leads are labelled Direct or Unassigned, and why? If it's a big share, a lot of your marketing is going uncredited, and the channel rankings in the report are guesswork.
- Can you show me one real client's journey, from first ad click to signed deal? Not a model or a chart. One actual person. If nobody can produce it, nobody is connecting the data.
- What outcome are our campaigns optimizing toward? If the answer is "form fills," ask what it would take to optimize toward qualified leads or new clients.
- What do we send back to the ad platforms, and how often? If the answer is "nothing beyond the form," the algorithms are working blind.
- Which number do we use to cut or scale spend, and how was it checked? If it comes straight from the platforms, it wasn't.
Two more things make it stick:
- Own your data. Your ad accounts, analytics and CRM should belong to you, with your agency given access. Not the other way around.
- Write the outcome into the relationship. The one-sentence goal from earlier goes into the agency agreement and the monthly report.
What a useful agency report should include
| What to see | What good looks like |
|---|---|
| Spend | By campaign and channel, tied to the agreed goal |
| Outcomes | Qualified leads, customers and revenue, not just form fills |
| Cost | Cost per qualified lead and cost per customer |
| Method | How traffic is labelled and credit is assigned, plus the known gaps |
| Changes | What changed last month, and why |
| Next steps | What to scale, cut, fix or test |
| Proof | How you'll know whether those changes worked |
A fair word on agencies
I work with a lot of agencies, and most of the ones I know are trying hard to do right by their clients. Many have excellent media buyers. What they often don't have is the tooling to connect ad clicks to CRM outcomes, or clients willing to pay for it. So they report what the platforms give them. That isn't dishonest. But checking those numbers against real outcomes is part of the job, and a platform number nobody has checked is an unverified number.
It's also worth being fair about what marketing controls. Once a lead arrives, how fast sales follows up, your pricing and the sales conversation all shape whether it becomes a customer. A slow follow-up can make a good campaign look bad. Connecting the data shows you where the drop happens, so you fix the right thing instead of blaming the wrong team.
The best agencies I've met welcome all five of these questions. Proof is how they keep clients for years. If your agency pushes back on every one of them, that tells you something too.
Where should you start this week?
You don't need to fix everything at once. Here's a worksheet you can do in an afternoon.
- Write the one sentence. "Marketing's job is to produce more ___ at a cost below ___." Get marketing, sales and your agency to agree.
- Pick one finished batch of leads. Leads from one campaign in a past month, old enough that most have had time to become clients (often 60 to 90 days).
- Match spend to real outcomes. Total ad spend for that campaign and month, and the people from it who became qualified leads and clients, each counted once in your CRM.
- Do the math. Spend divided by qualified leads, and by new clients. Put it next to cost per lead and see if the story changes.
- Look at what's missing. How many of those new clients have no known source, or show up as Direct? That's your blind spot.
- Start your weekly log. One row per week: spend by channel, and your agreed outcome. This is what a mix model will need later.
- Pick one change and test it. Move some budget, change what a campaign optimizes for, or fix tracking. Write down what result counts as success and the date you'll check.
Where does Kleerr fit?
We built Kleerr because we kept seeing the same thing: smart teams spending real money, with no reliable way to see what that money produced or what to change next.
Kleerr connects your ads, website and CRM. It traces each click to the person and the outcome, using HubSpot or Salesforce for lead gen. It finds what to fix: campaigns bringing in leads your sales team doesn't want, spend reaching people who are already clients, budget that should move. And it sends those real outcomes back to Google, Meta, LinkedIn and TikTok so they find more of the right people.
You can work with us two ways:
- Use the software yourself, with this article as your playbook.
- Have our team do it with Managed Ad Optimization. We set up the tracking and conversion signals, optimize the campaigns, and log every change with the reason behind it. We also tell you which improvements we only observed and which were confirmed by a controlled test.
For the bigger questions, our Advanced Measurement service (currently in early access) builds a marketing mix model and an incrementality testing plan around your data, and helps you set up lift tests in the ad platforms. If your data can't support a reliable answer yet, we'll tell you that before we build anything.
Want to see where your own numbers stand? Connect your accounts and we'll send you a free ad performance report: what's working, where spend is wasted, and the two or three changes we'd make first. No obligation.
The bottom line
It's hard out there. Every platform, tool and report is telling you a different story, and a lot of good marketers are second-guessing numbers they used to trust. That's not a sign you're doing it wrong. It's a sign you're paying attention.
You'll never get one perfect number. What you can get is a clear goal, an honest picture of what each source is measuring, and the right evidence for each decision: attribution for the day-to-day, a mix model for the big budget calls, and tests to prove what's real.
If your reporting can answer these three questions, you're in good shape:
- What worked?
- How do we know?
- What are we changing next month?
If it can't, start with the one sentence. Everything else gets easier from there.
Frequently asked questions
How do I know if my marketing is working?
Agree on one outcome that matters to the business, like qualified leads, pipeline or revenue. Then judge every campaign against that outcome, not clicks or form fills. Use click-based attribution for day-to-day decisions, a marketing mix model for budget splits, and tests to confirm what's causing results.
Why don't my Meta, Google and GA4 numbers match?
Each one counts something different. Ad platforms count conversions after clicks on, or views of, their own ads, so they overlap. GA4 labels website visits and loses many sources to Direct or Unassigned. None of them sees what happens in your CRM. Compare the same outcome over the same period before deciding which to trust.
Why does Meta report more leads than my CRM shows?
Meta counts leads from people who clicked an ad or only saw one, leads it estimates, and leads other channels also touched. Your CRM counts each real lead once. Click-based attribution sits in between: only leads linked to a specific ad click. The gap is the part worth testing.
How do I measure lead quality from my ads?
Follow every lead into your CRM and track what share of each campaign's leads become qualified, and what share of those become clients. Compare campaigns on cost per qualified lead and cost per new client, not cost per lead. Then send those qualified outcomes back to the ad platforms so they find more people like them.
What's the difference between multi-touch attribution and marketing mix modeling?
Multi-touch attribution follows individual clicks to individual customers and is best for day-to-day decisions inside channels. Marketing mix modeling looks at spend and results over time, with no individual tracking, and estimates what each channel adds overall. It's best for splitting budget across channels.
Is marketing mix modeling worth it for a B2B company?
Usually, if you spend meaningfully across two or more channels and have at least a year of weekly data. For B2B, model an outcome close to revenue, like qualified pipeline, and account for the delay between spend and closed deals. If you're not there yet, start keeping weekly data now.
What is incrementality testing?
A test that holds some people or regions back from your ads and compares them with those who saw them. The difference is what your marketing actually caused. It's the only direct way to separate persuaded buyers from people who would have bought anyway.
How do I hold my marketing agency accountable?
Agree on the outcome in writing, keep ownership of your ad accounts and data, and ask for one real client's journey from first click to signed deal. Judge results on qualified leads and new clients from your CRM, not platform-reported conversions.
Why is so much of my GA4 traffic labelled Direct?
GA4 labels a visit Direct when it can't find a source. That happens when browsers or ad blockers strip information, links are opened inside apps or private messages, or tracking tags are missing. One industry estimate puts about 30% of GA4 Direct traffic as actually coming from other channels.
Will AI agents break marketing attribution?
They'll make click-based attribution much less complete. When an AI assistant fills in a form or checks out for someone, there's no click trail to follow. Marketing mix modeling and incrementality testing don't depend on tracking individuals, so they'll matter more.
About the author. Daniel Pisterzi is co-founder and CEO of Kleerr, based in Calgary. He spends his days comparing what ad platforms claim against what actually happened in the business, and building the tools and services that close that gap.
Sources
- TransUnion / EMARKETER: marketers' confidence in measurement has stalled (Oct 2025)
- ASK BOSCO / OnePoll: state of marketing reporting (Jan 2025)
- Top Draw: why GA4 Direct traffic is mislabeled (Feb 2026)
- Kleerr case study: what $60K/mo of Shopify ad spend actually bought (May 2026)
- Kleerr: view-through attribution, when to trust it and how to audit it