
How to work out blended ROAS: divide total revenue by total ad spend for the same time period. If your store made $120,000 in revenue and spent $30,000 on ads, blended ROAS is 4.0x. That number is useful, but only if the revenue and spend inputs are clean.
TL;DR
> - Blended ROAS = total revenue ÷ total ad spend.
> - Use the same date range, currency, and revenue definition for both inputs.
> - Blended ROAS shows overall paid efficiency. It does not tell you which channel deserves more budget.
> - Shopify teams should compare blended ROAS against verified order revenue before scaling, cutting, or reallocating spend.

What is blended ROAS?
Blended ROAS is total revenue divided by total ad spend across paid channels. It gives you one efficiency number for your whole paid media program. It is useful for a top-level read, but it does not explain which channel created the revenue or which channel should get more budget.
The formula is:
| Metric | Formula |
|---|---|
| Blended ROAS | Total revenue ÷ total ad spend |
Example:
| Input | Value |
|---|---|
| Total revenue | $120,000 |
| Total ad spend | $30,000 |
| Blended ROAS | 4.0x |
A 4.0x blended ROAS means the business generated $4 in revenue for every $1 spent on ads.
Blended ROAS is also called total ROAS, blended return on ad spend, or account-level ROAS. The name matters less than the rule: use total revenue and total ad spend from the same period.
How do you work out blended ROAS?
To work out blended ROAS, add up total revenue for the period, add up total ad spend for the same period, then divide revenue by spend. Use one revenue source, one spend definition, one currency, and one timezone so the result is clean enough to guide a decision.
Use this process:
- Pick the date range.
- Pull total store revenue for that date range.
- Pull total ad spend across paid channels for the same date range.
- Confirm both use the same currency and timezone.
- Divide revenue by ad spend.
- Compare the result to your target ROAS or break-even point.
Example:
| Step | Number |
|---|---|
| Shopify revenue | $250,000 |
| Meta spend | $35,000 |
| Google spend | $20,000 |
| TikTok spend | $5,000 |
| Total ad spend | $60,000 |
| Blended ROAS | 4.17x |
The math is:
`$250,000 ÷ $60,000 = 4.17`
That means the paid program returned $4.17 in revenue for every $1 spent.
What revenue should you use for blended ROAS?
Use ecommerce revenue that matches the business decision you are trying to make. For Shopify teams, completed order revenue is the clean starting point. If margin pressure is the issue, also check net revenue after refunds, discounts, shipping, taxes, and fees where your reporting supports it.
The most common mistake is using whatever number is easiest to pull.
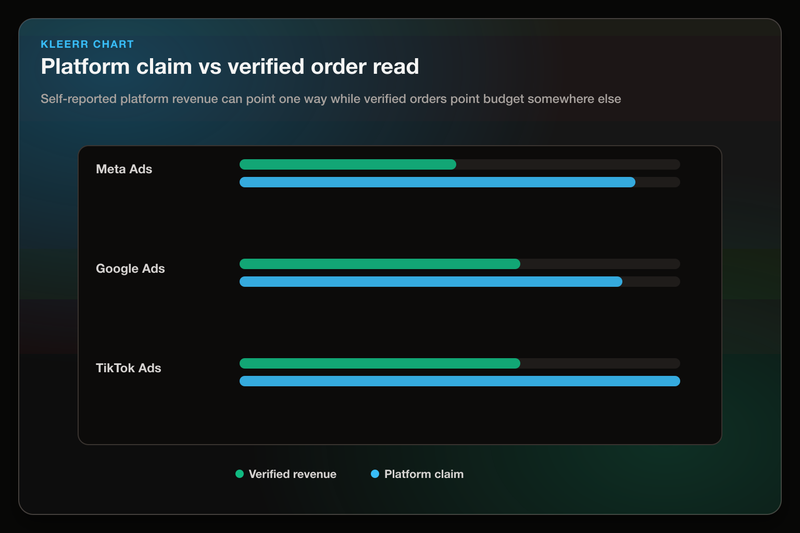
Meta may report one revenue number. Google may report another. GA4 may report another. Shopify may show a different store total. Those numbers can all be useful, but they are not the same source of truth.
For blended ROAS, choose one revenue definition and keep it consistent.
| Revenue input | When to use it | Risk |
|---|---|---|
| Gross store revenue | Fast top-line read | Can overstate performance if refunds or discounts are high |
| Net revenue | Better margin read | Requires cleaner finance or ecommerce data |
| Platform-attributed revenue | Channel reporting | Can double-count or miss revenue across platforms |
| Verified order revenue | Budget decisions | Requires order-level reconciliation |
Our take: blended ROAS should start from store revenue, not from the sum of each ad platform's claimed revenue.
Kleerr's platform overview shows the gap this creates: verified signals in, attribution across channels, and cleaner events or audiences put to work after the read.
What ad spend should you include in blended ROAS?
Include the ad spend you want the blended ROAS number to judge. Most Shopify teams include paid media spend across Meta, Google, TikTok, and other acquisition channels. Keep agency fees, creative costs, software costs, and discounts separate unless you are calculating contribution profit.
This is the clean version:
| Include in basic blended ROAS | Keep separate for deeper profit analysis |
|---|---|
| Meta ad spend | Agency fees |
| Google Ads spend | Creative production |
| TikTok ad spend | Discounts |
| Affiliate or creator spend, if managed like paid media | Shipping |
| Other paid acquisition spend | Payment fees |
| Retargeting spend | Cost of goods sold |
Do not change the spend definition month to month.
If January blended ROAS includes only ad platform spend, February should use the same rule. If you add creator spend, note the change so the trend does not look worse for the wrong reason.
What is a good blended ROAS?
A good blended ROAS is the number that clears your break-even point and leaves enough margin to operate. There is no universal good ROAS because product margin, repeat purchase rate, discounting, and fulfillment cost change the answer for each brand.
A 3.0x blended ROAS can be strong for one business and weak for another.
Start with break-even ROAS:
| Input | Example |
|---|---|
| Gross margin | 60% |
| Break-even ROAS | 1.67x |
The formula is:
`1 ÷ gross margin = break-even ROAS`
With 60% gross margin, the business needs $1.67 in revenue for every $1 of ad spend before other costs.
That is only the floor.
A brand with high repeat purchase can afford a lower first-order ROAS if customers come back profitably. A brand with heavy discounting, high shipping cost, or low repeat behavior needs a higher target.
Why can blended ROAS look healthy while budget is still wasted?
Blended ROAS can look healthy because it averages every channel together. One channel can be over-credited, another can be under-credited, and the total can still look fine. That makes blended ROAS useful for a top-level check, but weak for deciding where the next dollar should go.
This is where many teams overpay for orders.
The blended number may say paid media is working. But it may hide a bad mix:
| Channel | Platform view | Verified read | Budget risk |
|---|---|---|---|
| Paid social | Looks efficient | Claims too much revenue | Overspend |
| Paid search | Looks weaker | Drives more verified orders | Underspend |
| Claims revenue it touched | May overlap with paid retargeting | Duplicate effort | |
| Retargeting | Looks high ROAS | May chase existing buyers | Retargeting tax |
In one Shopify audit, one ad platform claimed a 5.4x ROAS, but verified Shopify revenue showed 1.2x, according to Kleerr's published Shopify marketing data audit. That is one audit, not a market benchmark, but it shows why blended ROAS should not be the only budget signal.
Blended ROAS tells you whether the total engine is efficient. It does not prove each channel earned its credit.
Want to pressure-test your own numbers? Use the free ROAS calculator to work out blended ROAS and MER from your spend and verified revenue.
How should Shopify teams use blended ROAS with CAC and MER?
Shopify teams should use blended ROAS with CAC and MER because each metric answers a different question. Blended ROAS shows ad efficiency. CAC shows customer acquisition cost. MER shows total revenue efficiency against marketing spend. Together, they help explain whether growth is efficient, profitable, and actually acquiring new buyers.
Use the metrics together:
| Metric | Formula | Question it answers |
|---|---|---|
| Blended ROAS | Total revenue ÷ total ad spend | Is paid media efficient overall? |
| CAC | Acquisition spend ÷ new customers | What does it cost to acquire a buyer? |
| MER | Total revenue ÷ total marketing spend | Is marketing efficient at the business level? |
| Contribution profit | Revenue minus variable costs | Did growth create profit? |
Blended ROAS can improve while new-customer CAC gets worse.
That happens when paid media shifts toward existing customers, branded search, retargeting, or buyers who would have purchased through email anyway. The revenue still shows up. The acquisition quality may not.
For a Shopify team under margin pressure, the better question is not only "What was blended ROAS?"
The better question is: "Which spend created new, profitable orders we would not have captured cheaply elsewhere?"
How do you improve blended ROAS without guessing?
Improve blended ROAS by fixing the biggest waste first: poor tracking, channel overlap, weak budget allocation, and paid retargeting that chases customers owned channels can reach. Do not start by cutting the lowest platform ROAS number until you check it against verified orders.
A practical order of operations:
- Verify revenue. Compare platform-claimed revenue to completed ecommerce orders.
- Separate new and repeat buyers. A high ROAS campaign may be heavy on existing customers.
- Check channel overlap. Paid, email, SMS, and branded search can all touch the same order.
- Suppress reachable buyers. Stop paying to retarget customers email or SMS can reach.
- Move budget by verified performance. Shift spend toward the channel that creates real orders at the right cost.
- Watch contribution profit. A higher ROAS with deeper discounts may still be worse.
Not sure if your blended ROAS is hiding a channel gap? See how Kleerr helps Shopify ecommerce teams compare self-reported platform performance against real order revenue before moving spend.
What is the difference between blended ROAS and platform ROAS?
Blended ROAS measures total revenue against total ad spend across paid media. Platform ROAS measures the revenue a single platform claims against its own spend. Blended ROAS is better for business-level efficiency. Platform ROAS is useful for channel management, but it should not be treated as a neutral source of truth.
The difference is simple:
| Metric | View | Best use | Main risk |
|---|---|---|---|
| Blended ROAS | Whole paid program | Top-level efficiency | Hides channel mix problems |
| Platform ROAS | One ad platform | In-platform optimization | Each platform grades its own work |
| Verified ROAS | Orders reconciled to revenue | Budget allocation | Requires cleaner data |
A platform can report strong ROAS because it saw a touchpoint before purchase. That does not prove it created the order or deserves more budget.
Blended ROAS can keep the team grounded, but verified revenue should guide reallocation.
What is a simple blended ROAS checklist?
A simple blended ROAS checklist should confirm the formula, inputs, date range, and decision rule before anyone changes spend. If the revenue, spend, timezone, or attribution source changes, the blended ROAS trend can move for reporting reasons instead of business reasons.
Use this checklist:
- [ ] Revenue and spend use the same date range.
- [ ] Revenue comes from the ecommerce source you trust.
- [ ] Spend includes the same channels each period.
- [ ] Currency and timezone match.
- [ ] Refunds and discounts are handled consistently.
- [ ] New and repeat customers are reviewed separately.
- [ ] Platform ROAS is not added together as if it were store revenue.
- [ ] Blended ROAS is compared with CAC, MER, and margin.
- [ ] Budget changes are checked against verified orders.
- [ ] The team knows what action the number should trigger.
A metric is only useful if it changes a decision.
FAQ: How to work out blended ROAS
Blended ROAS is simple math, but the inputs matter. Use total revenue divided by total ad spend, then check whether that result matches verified ecommerce revenue, new-customer CAC, and margin before using it to move budget.
How to work out blended ROAS?
Divide total revenue by total ad spend for the same period. For example, $100,000 in revenue divided by $25,000 in ad spend equals a 4.0x blended ROAS.
Is blended ROAS the same as MER?
No. Blended ROAS usually compares revenue to ad spend. MER compares revenue to broader marketing spend. Some teams use the terms loosely, so define the spend input before comparing results.
Should I use Shopify revenue or ad platform revenue?
Use Shopify revenue for the cleanest business-level blended ROAS. Platform revenue is useful inside each ad account, but it can overlap, miss orders, or claim revenue from a platform-specific view.
Can blended ROAS tell me which channel to scale?
No. Blended ROAS tells you whether the whole paid program is efficient. To decide which channel to scale, compare channel claims against verified orders, CAC, new-customer mix, and margin.
How often should I check blended ROAS?
Check it weekly for operating decisions and monthly for trend quality. Daily blended ROAS can swing because of attribution lag, purchase delay, and normal demand changes.
What is the biggest mistake with blended ROAS?
The biggest mistake is using a clean-looking blended number to ignore channel waste. A healthy average can hide overspend in one channel and underinvestment in another.
Ready to verify your blended ROAS?
If blended ROAS tells you paid media is working, the next question is where the next dollar should go. Compare platform-reported performance against real Shopify orders, then decide what to scale, hold, or cut from the verified read.
For Shopify DTC teams, Kleerr helps audit the gap between self-reported platform performance and verified store revenue, then turns that gap into clearer budget and audience decisions. See Kleerr for ecommerce.
About the author
Daniel Pisterzi owns the Kleerr content brief and leads Kleerr's marketing analytics positioning. He writes from Kleerr's work auditing Shopify ad data, comparing platform-reported performance to verified store revenue, and translating those gaps into clearer budget and audience decisions for operators.